Lead Product Designer @ TIMELY
Sep 2023 - Sep 2024
Introduced a journey management practice and established metric ownership across the design team
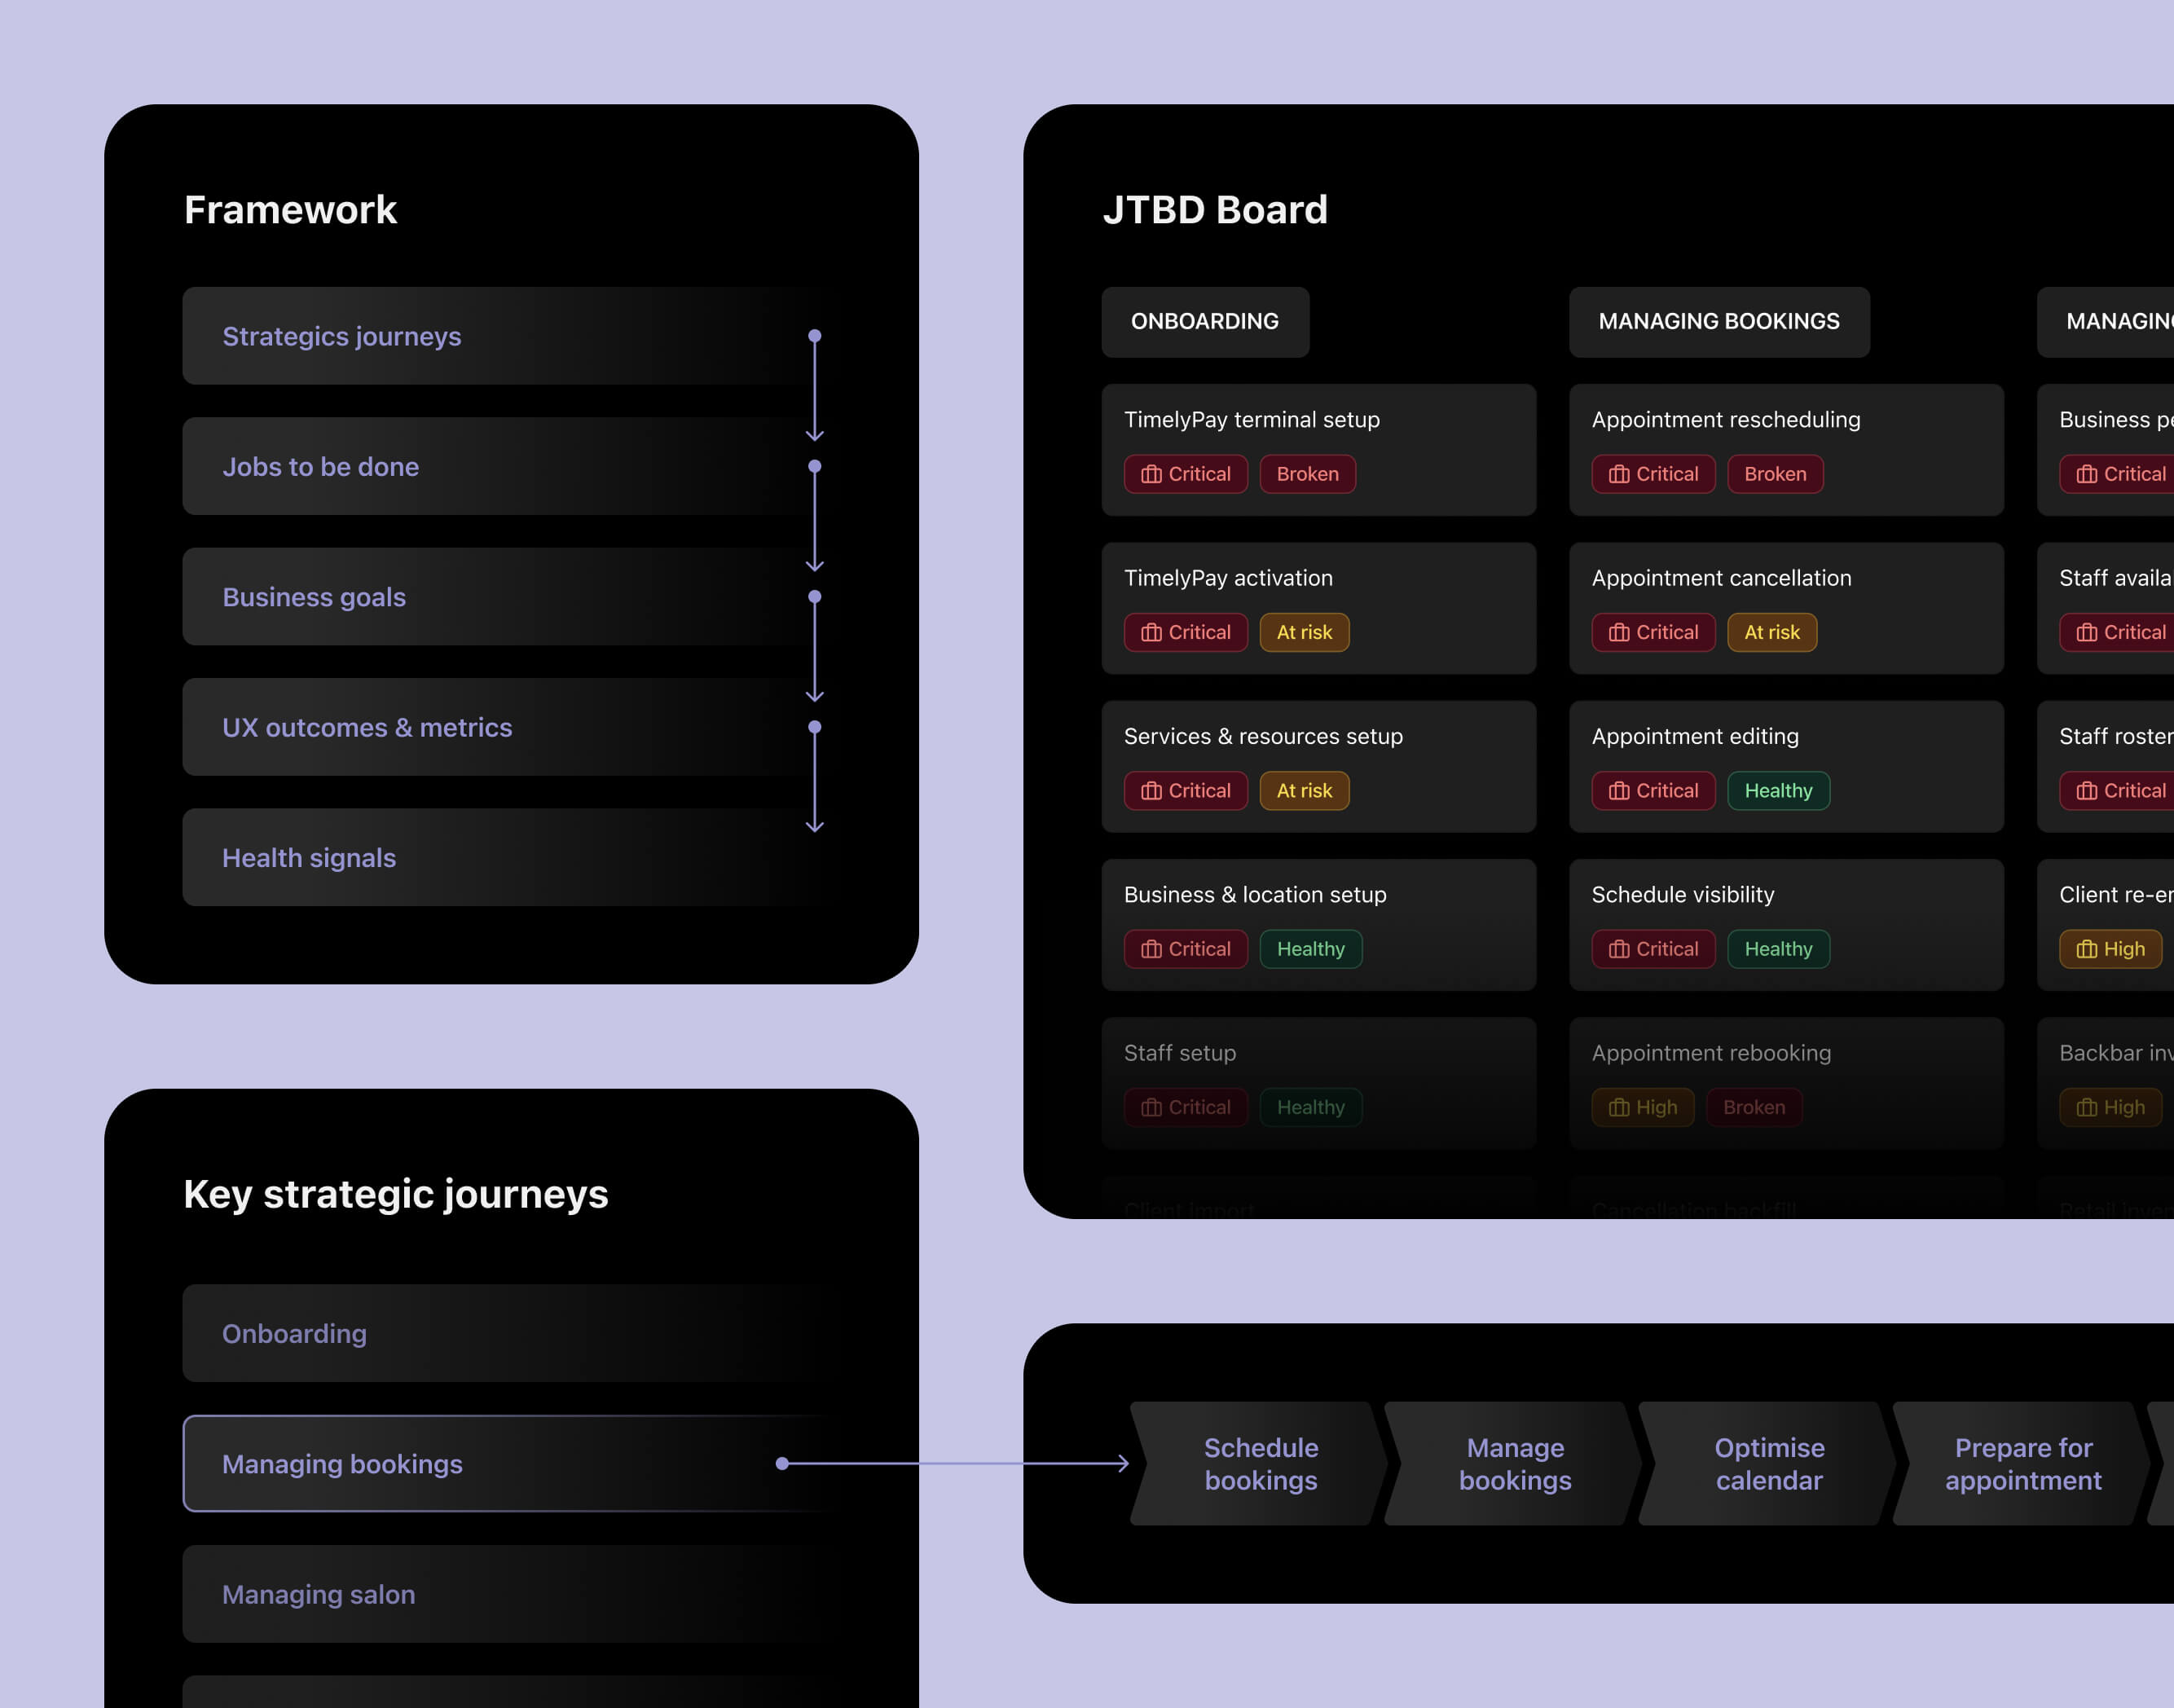
The calendar redesign made the case for quantitative design decisions
The calendar touched everything, scheduling, billing, client management, and most daily usage. Looking at utilisation data, click patterns, screen recordings, and support tickets together made one thing clear. The real problems were not visual inconsistency, but broken journeys and friction in small, repeated tasks, issues that qualitative research would have taken much longer to surface.
The goal shifted from visual improvements and design system adoption to measurable outcomes, fewer clicks, higher task success rates, and healthier journey completion. That shift led directly to the journey management practice and a stronger focus on measuring design decisions.
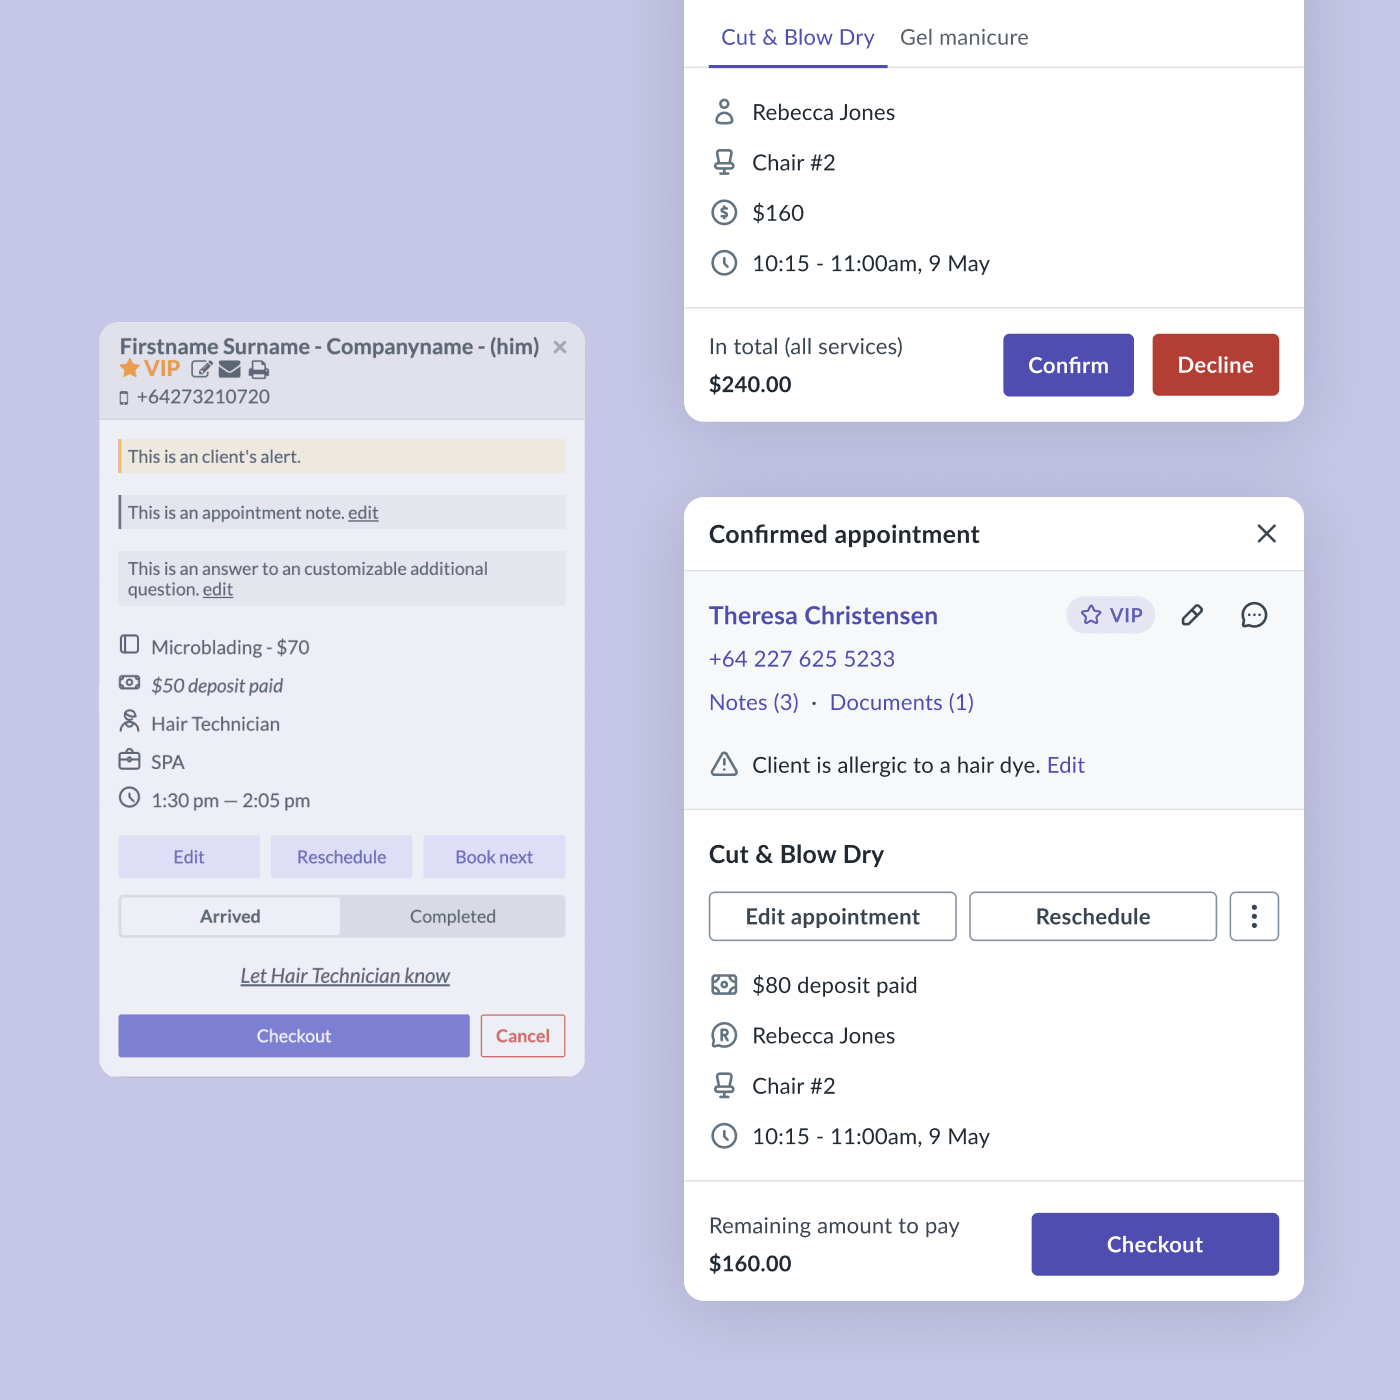
A framework designers could maintain without it becoming extra work
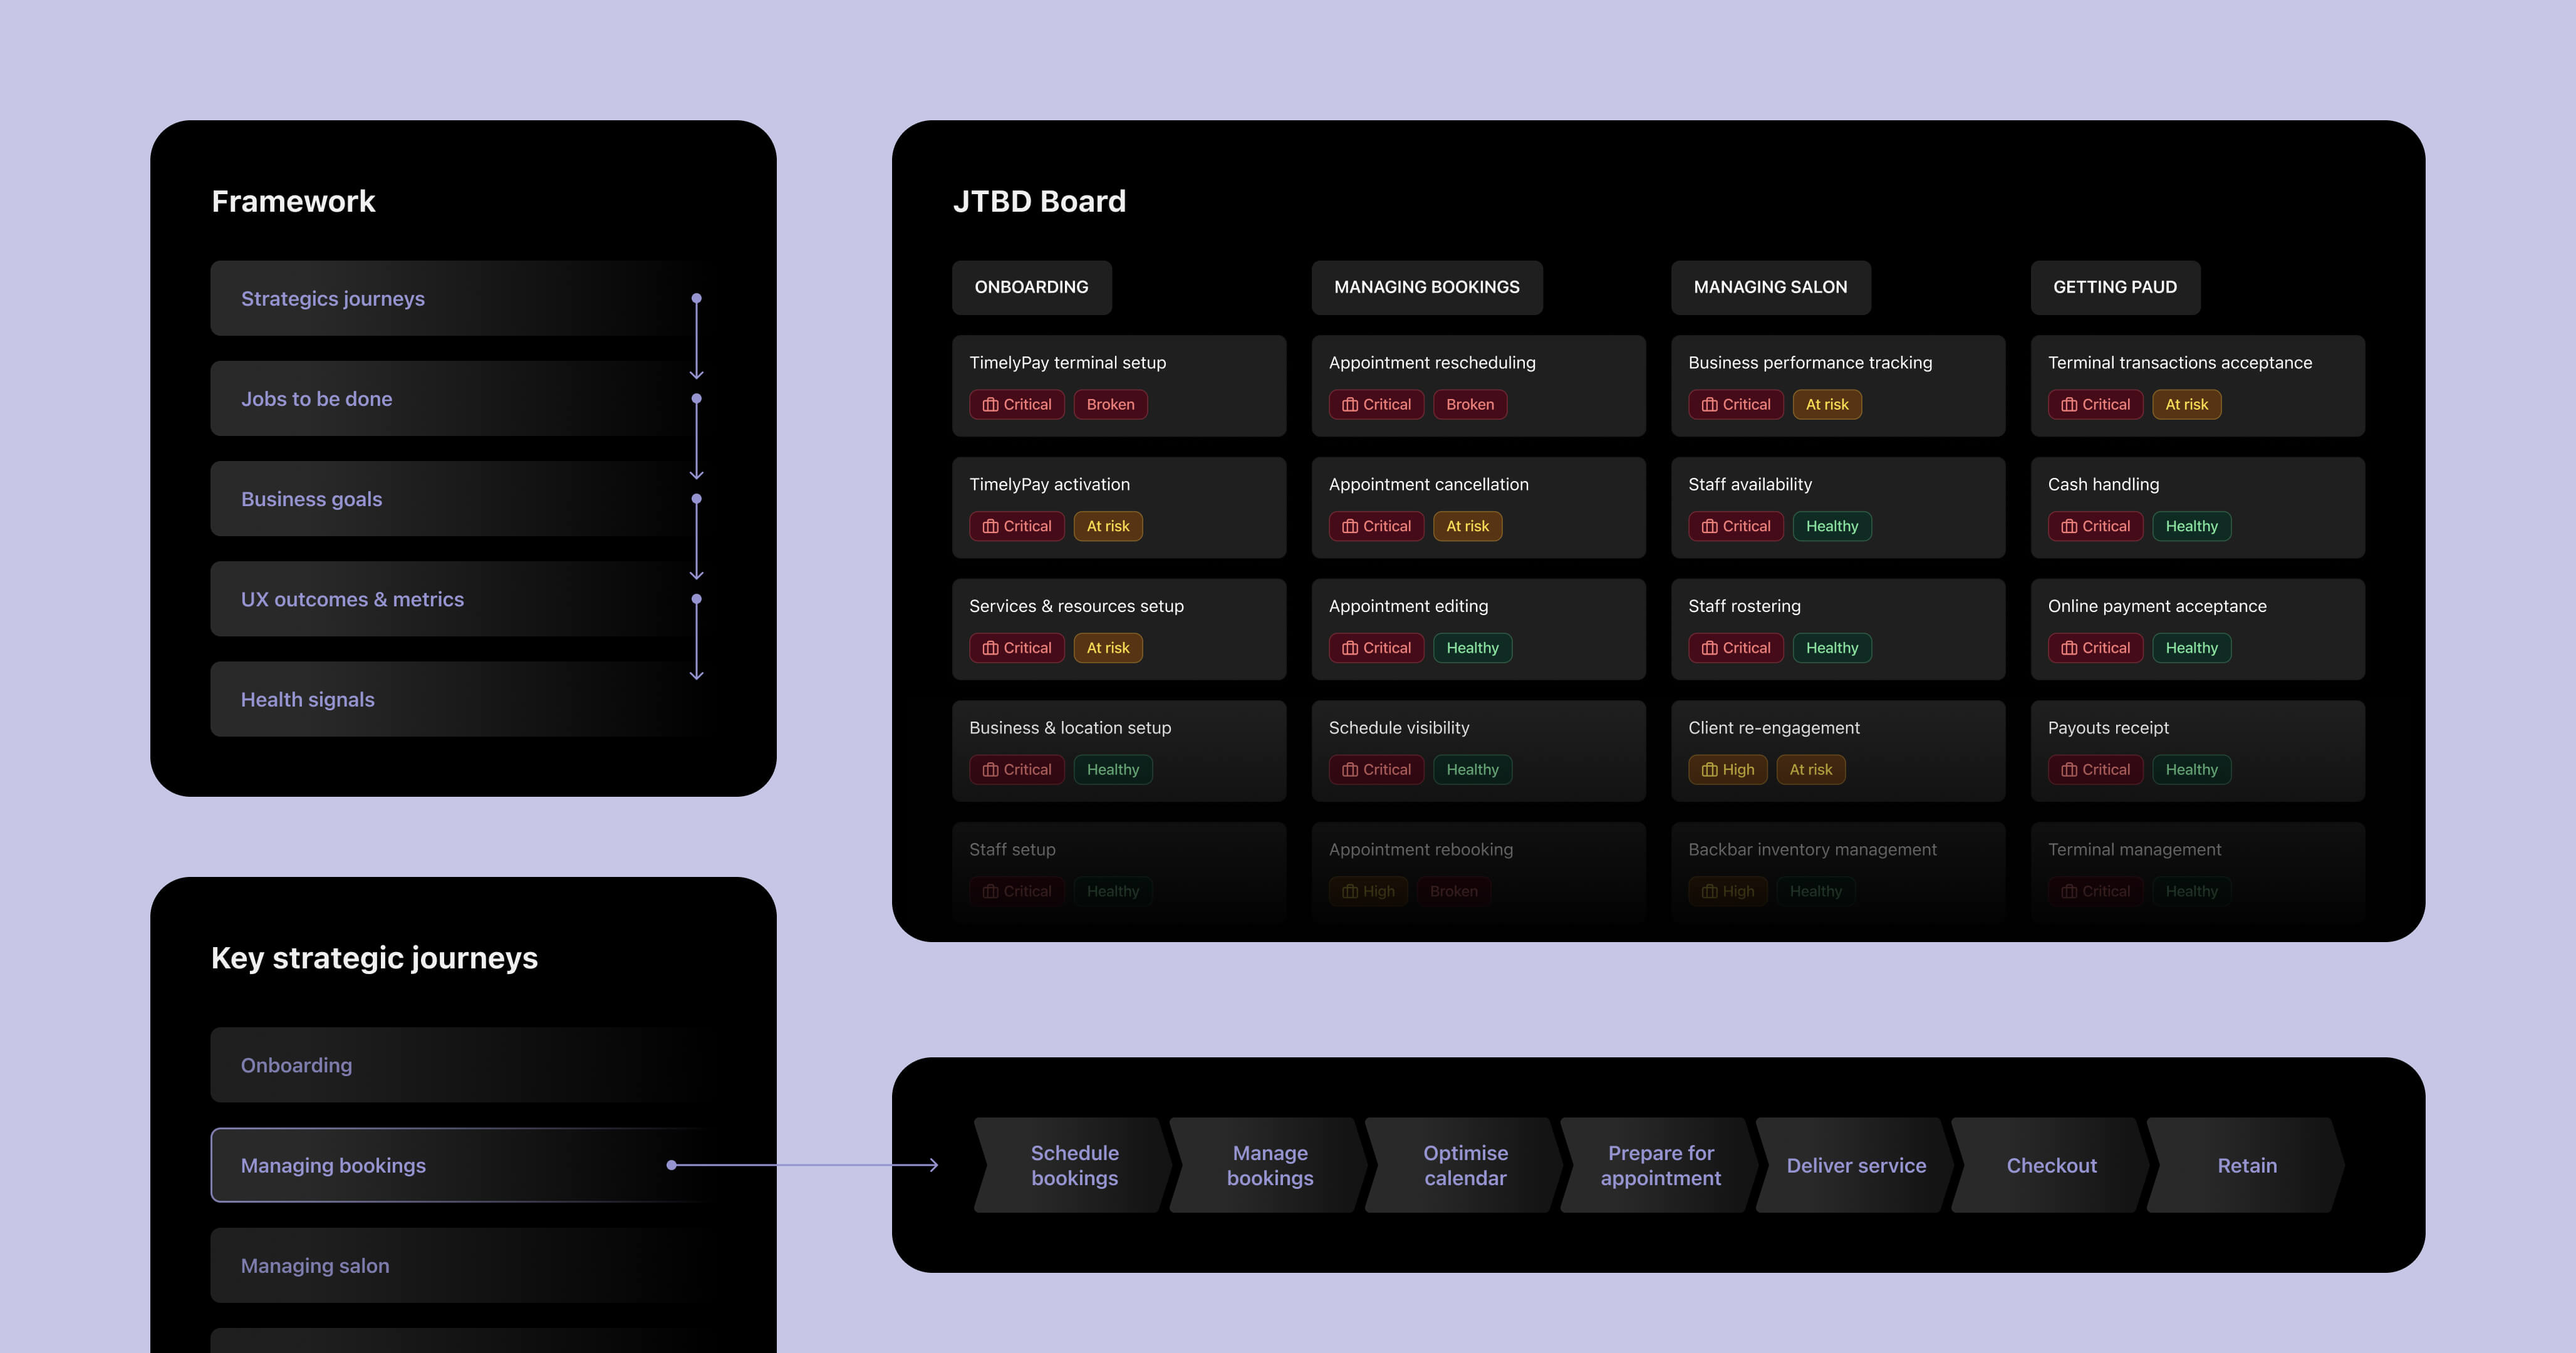
I mapped four strategic journeys based on what salon owners were trying to achieve: onboarding, managing bookings, running the salon, and getting paid.
0
0
Strategic journeys
0+
0+
JTBD mapped
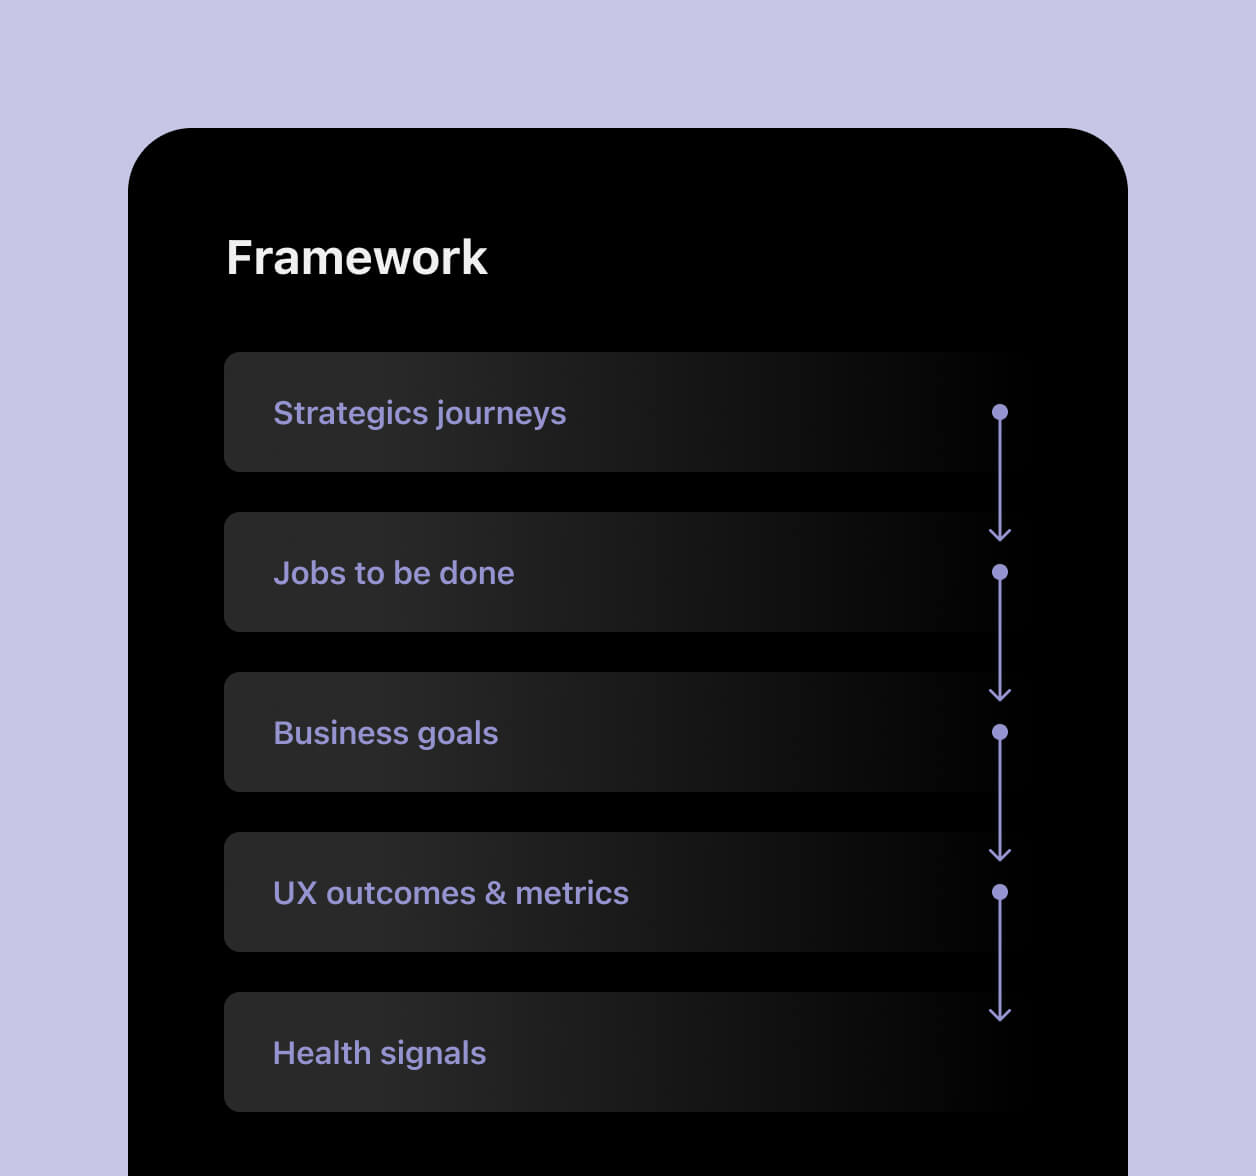
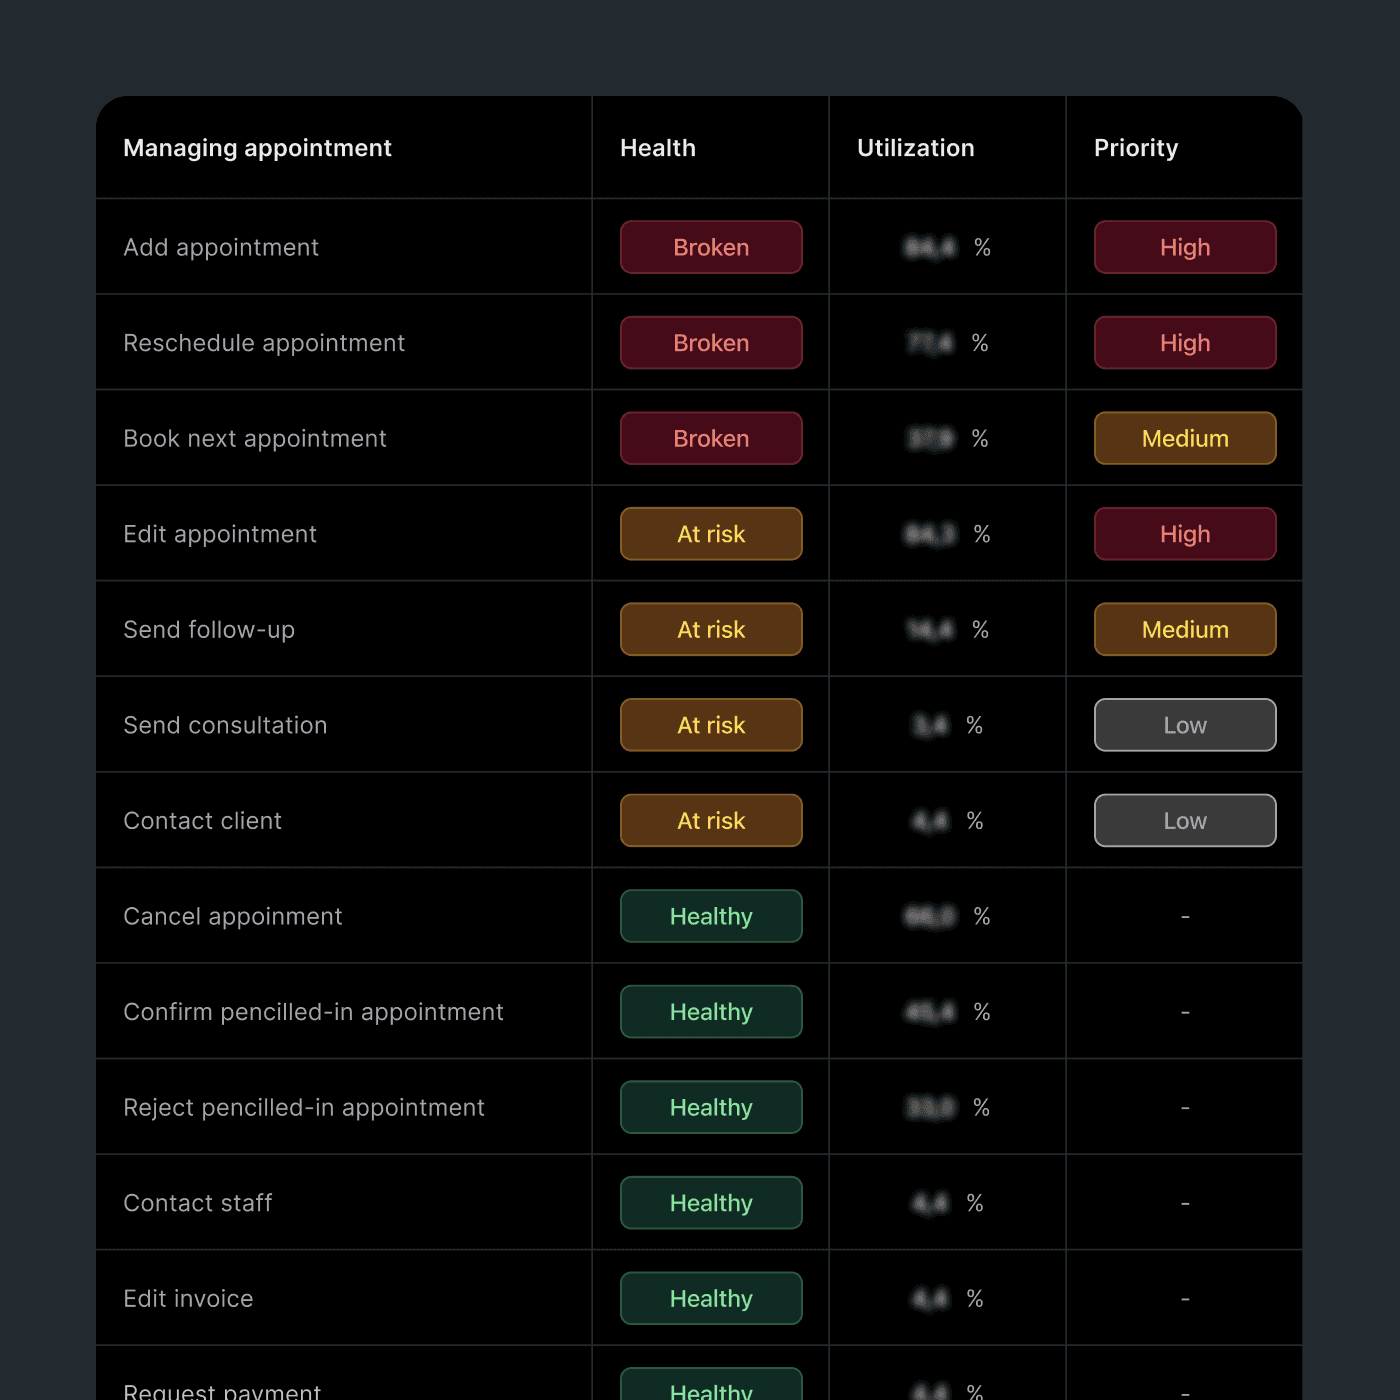
Working with UX researchers, we defined the JTBD across these journeys, each with a health signal and a clear owner. Qualitative research explained intent, while utilisation, drop-off points, and task success showed whether each job was healthy, at risk, or broken.
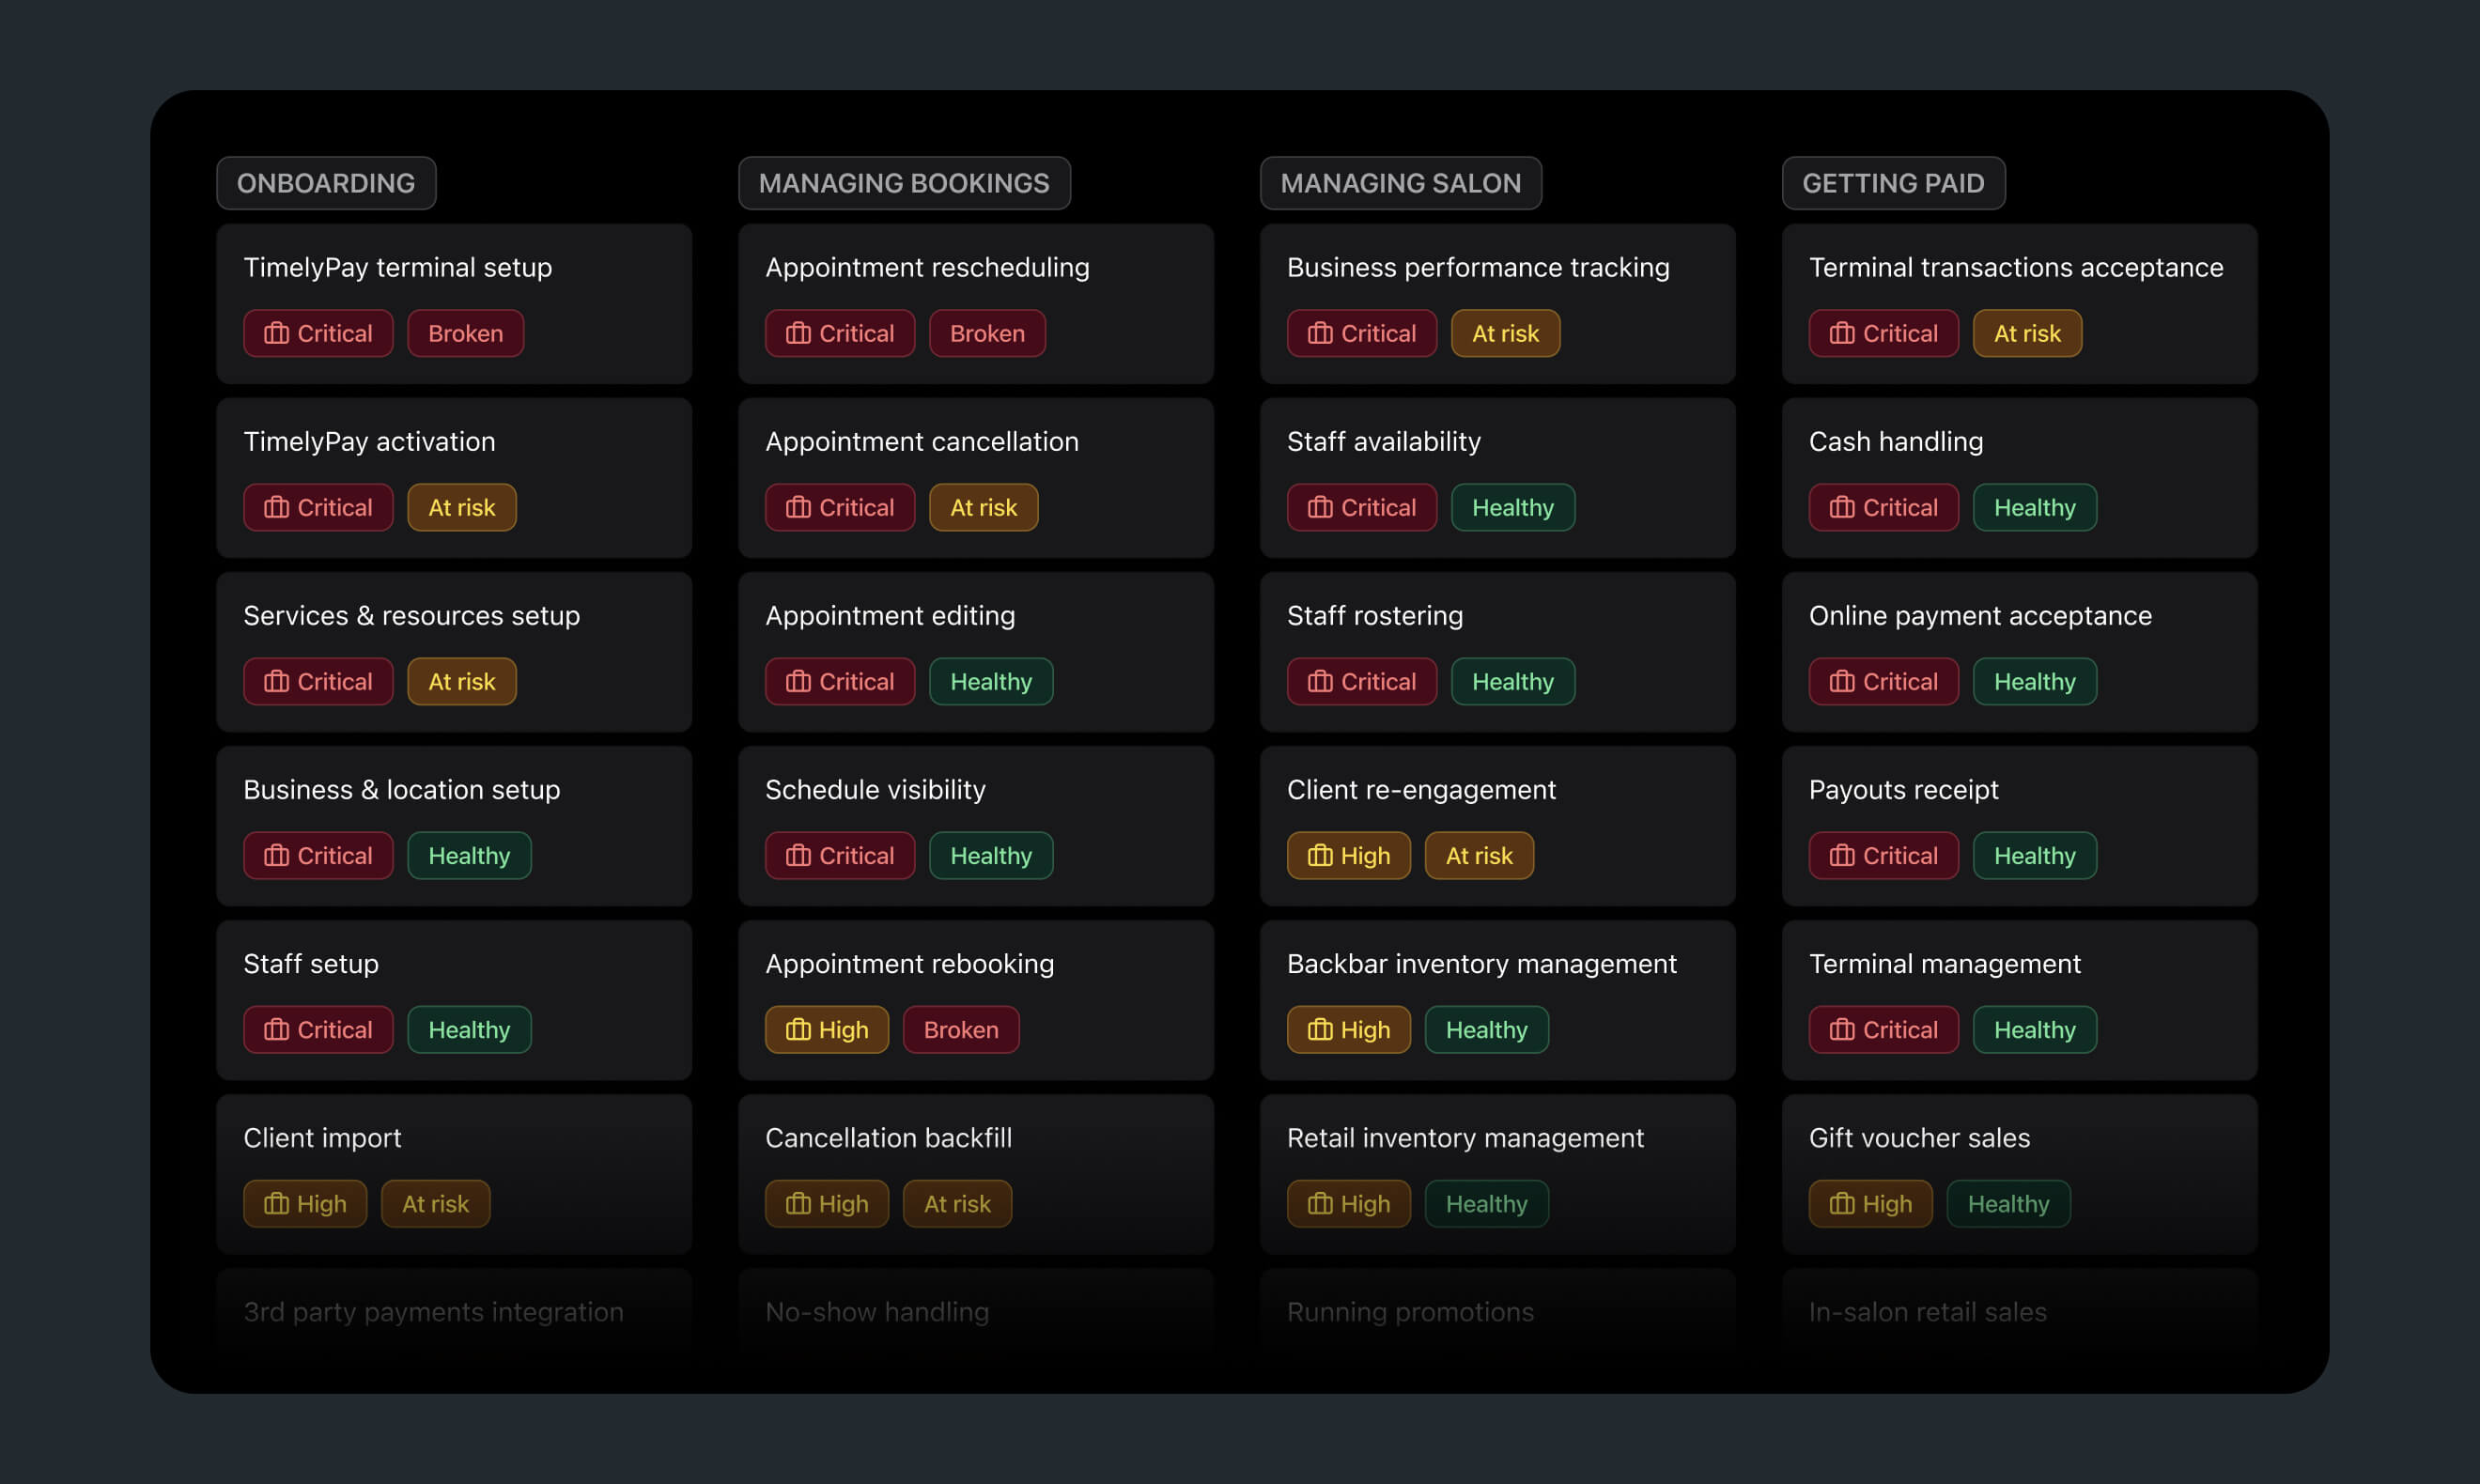
Designers focused on two or three jobs per quarter based on business priorities. The full map was a reference, not a workload. It made design critiques sharper, cross-team communication easier, and coaching more specific.
Optimising the revenue journey to increase activation and reduce time from 17 hours to minutes
TimelyPay terminal setup was a critical onboarding step. Reaching the first transaction quickly meant salon owners stayed on Timely rather than evaluating alternatives. I mapped the journey end to end and analysed the data in Snowflake to identify where drop-offs concentrated and for which customer segments.
The biggest opportunity was between requesting and receiving access. Most trial users showed clear intent, but then waited an average of 17 hours for approval, often up to 72, with some never returning.
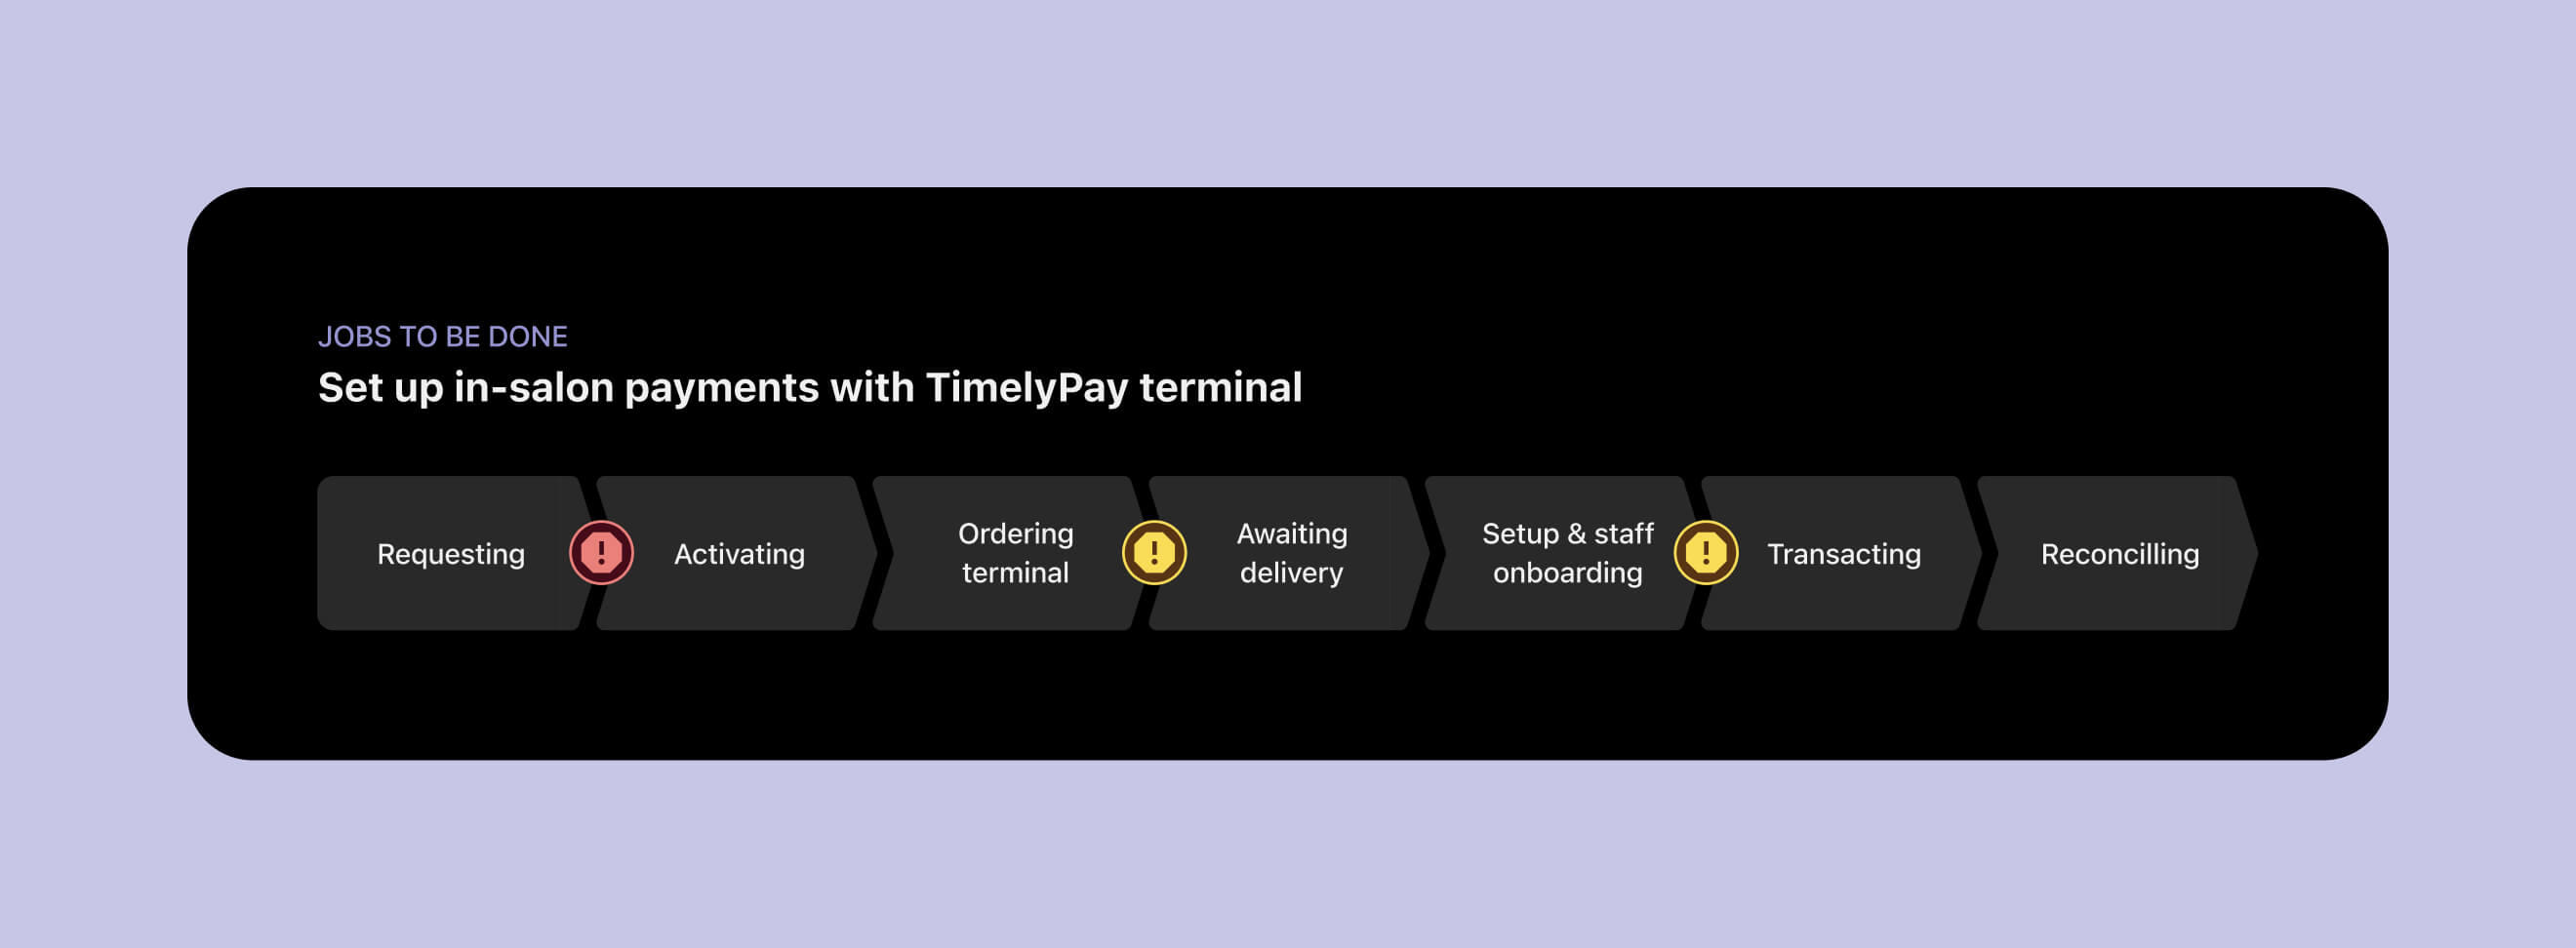
The fix was not in the interface, but in the underlying processes. The delay came from a manual anti-fraud flow, with some markets adding a sales layer that increased friction. The data showed manual errors, inconsistent reviews, and some users skipped entirely. Bringing this evidence to stakeholders created the alignment needed to change a process outside my ownership.
Working with risk and operations, we separated low-risk users for instant approval from cases requiring review, and adjusted sales workflows to avoid blocking unassisted activations. This increased conversion from trial to TimelyPay activation and accelerated time to first transaction without increasing fraud.
0%
0%
Reduction in activation time
30%
30%
Fraud increase
Filip is pragmatic, strategic, and highly dependable. His strengths in interaction design, UX metrics, and driving measurable outcomes make him a valuable contributor.
Amanda Judd
Head of Design @ Timely
Reflection and takeaways
The biggest shift was not the framework, but how designers saw their role. With structure and working examples, they began owning metrics they had not owned before.
Some of that tracking was intentionally approximate. A rebooking rate defined as clicking rebook and saving within two minutes is not perfect, but it is fast and directionally honest. A signal that moves within a week is more useful than a cleaner dataset that arrives too late to shape the work.
Defining the right metric is harder than it looks. A single indicator is often misleading. Averages hide outliers, medians hide skew, and distribution tells a different story. The most reliable signal comes from looking at the same problem from multiple angles and validating before acting.
This thinking extended beyond product metrics into operational flows like TimelyPay, where the highest-impact improvements came from measuring and fixing processes outside the interface.